Experiments
#3 PLASTIC MICROPARTICLES IN BOTTLED DRINKING WATER


How Students Can Observe and Measure Microplastic Particles in Drinking Water
Introduction
Plastics are a relatively recent phenomenon to humankind started on a large scale only about 80 years ago with advancements in chemistry creating polymers mainly synthesized from fossil fuels such as petroleum oil and natural gas. They can be made into products with very desirable characteristics and relatively cheaply, and are now used throughout the world for many different applications including packaging, industrial components, medical equipment, and fabrics. They have grown tremendously and have reached world-wide production levels of 400 million metric tons per year with an annual growth rate recently of four percent per year. Because of their durability it is believed that remnants of the first plastics manufactured are still around us today and will continue to persist for decades into the future.
Plastics break up and shed off particles such as microparticles and nanoparticles that enter into everything including our bodies, fish, other animals, and plants including agricultural products. In recent years, the ubiquitous presence of microplastics in the environment has become a growing concern worldwide. Microplastics, defined as plastic particles smaller than 5 millimeters in size, have infiltrated various ecosystems, including freshwater sources like rivers, lakes, and underground aquifers. Even smaller particles called nanoparticles 1000 times smaller than micro plastics are more invasive getting into our brains and blood streams. One critical area where their presence raises alarm is in drinking water.
The pervasiveness of microplastics in drinking water has prompted extensive scientific research to understand their sources, distribution, and potential impacts on human health. While the exact health implications of consuming microplastics through drinking water are still under investigation, there is a growing body of evidence suggesting potential risks associated with their ingestion, such as the absorption of toxic chemicals present in plastics and their potential to act as vectors for harmful pathogens. A fundamental question today is what harm do these microplastics cause to humans, plants, and animals?
The main purpose of this laboratory experiment is to demonstrate vividly and directly to students the presence of microplastics commonly consumed in drinking water obtained in bottled containers, at drinking fountains, and in lakes and rivers. We employ in this experiment a chemical dye called Nile Red that chemically discriminately attaches onto these particles and when illuminated by a special type of blue crime light can be seen by the naked eyes through orange-colored glasses and small 10X magnifying glasses.
Laboratory Procedures
Classes are typically composed of 15 – 20 students, mainly juniors and seniors assembled in a laboratory science room with lab tables, student work desks, and whiteboard with links into student and teachers lap-top computers or other portable devices. Students are pre-organized into small lab teams of 3-4 students each. Most students have already had some chemistry and biology, and many have participated in in-person laboratory experiences.
Typical class length is approximately 60 minutes and in some schools such as private schools 90 minutes which when compactly organized, carefully prepared for ahead of time, and constrained to brief, quick discussion of questions, is an adequate amount of time. In some situations, several class periods are used to give adequate time for advanced discussions and close examination of conclusions and the implications.
Students are sent a handout with a list of questions a day or two before the actual lab experiment date and asked to prepare answers and be ready for verbal discussion in class. (Copy of hand-out is attached below.)
Schedule for one-hour class is as follows:
1. Water samples, pipettes, and test tubes are carefully labeled with small color labels to keep the experiment closely controlled and consistent across all teams.
2. Distributed samples of purchased commercial water in plastic bottles are given to each team. In addition, students can be asked to bring one sample from home that might be another commercial brand, tap water, refrigerated filtered water, or even local pond water.
3. Students then, using furnished glass pipettes, draw 7 – 8 mL of water from each sample and deposit into 10 mL glass test tubes also color coded. A unique pipette is used for each water sample to minimize cross-contamination.
4. When completed, a MAG representative and instructor then go to each table dripping twenty-four (24) drops of pre-mixed Nile Red dye into each test tube using a small eyedropper. After gently shaking the test tubes with a thumb covering the top (Nile Red is non- toxic nor - harmful) students start their timers for the 30 - 40 minutes necessary to give the chemical reactions time to work effectively.
5. Moving back to their desks, the class engages in a moderated, interactive, insightful, lively, and at times humorous discussion following the handout and previously assigned questions. This takes about 20 – 25 minutes. Students will have read the handout of articles a day or two before the class and thought about their responses to the questions.
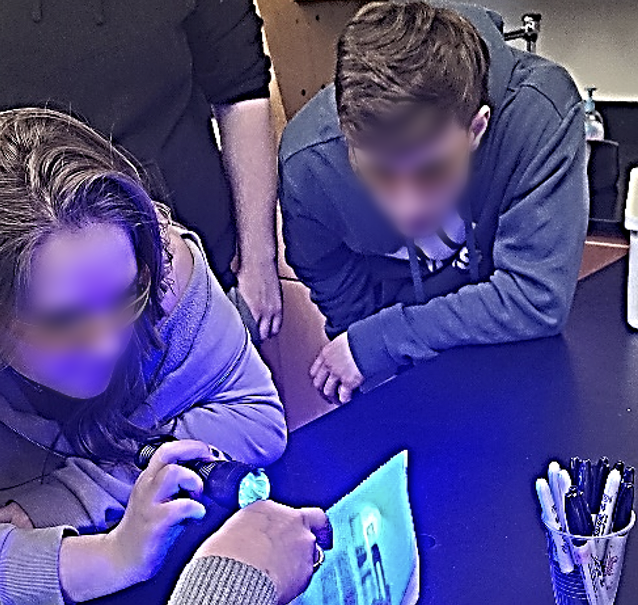
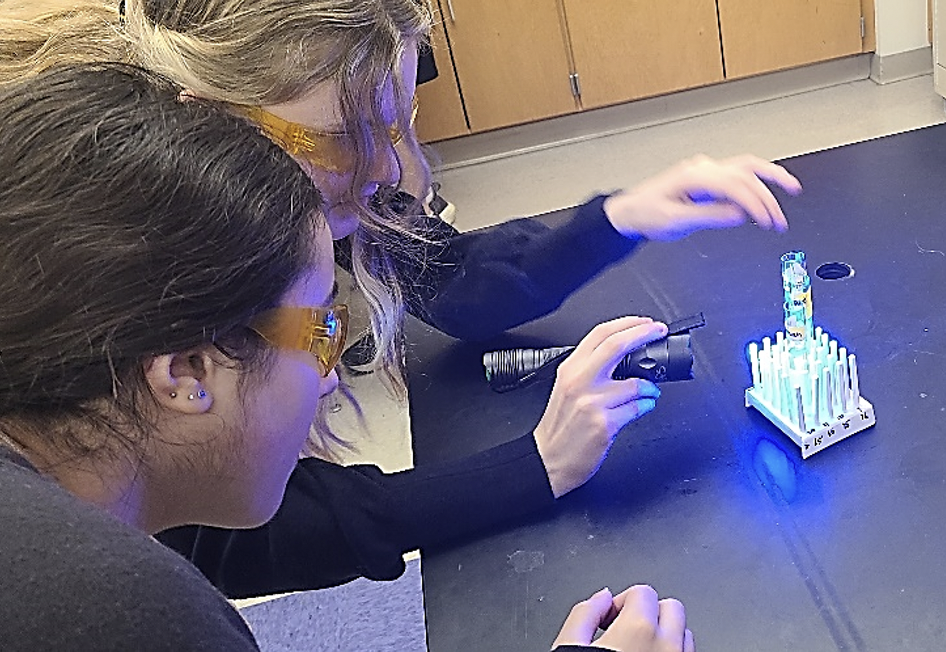
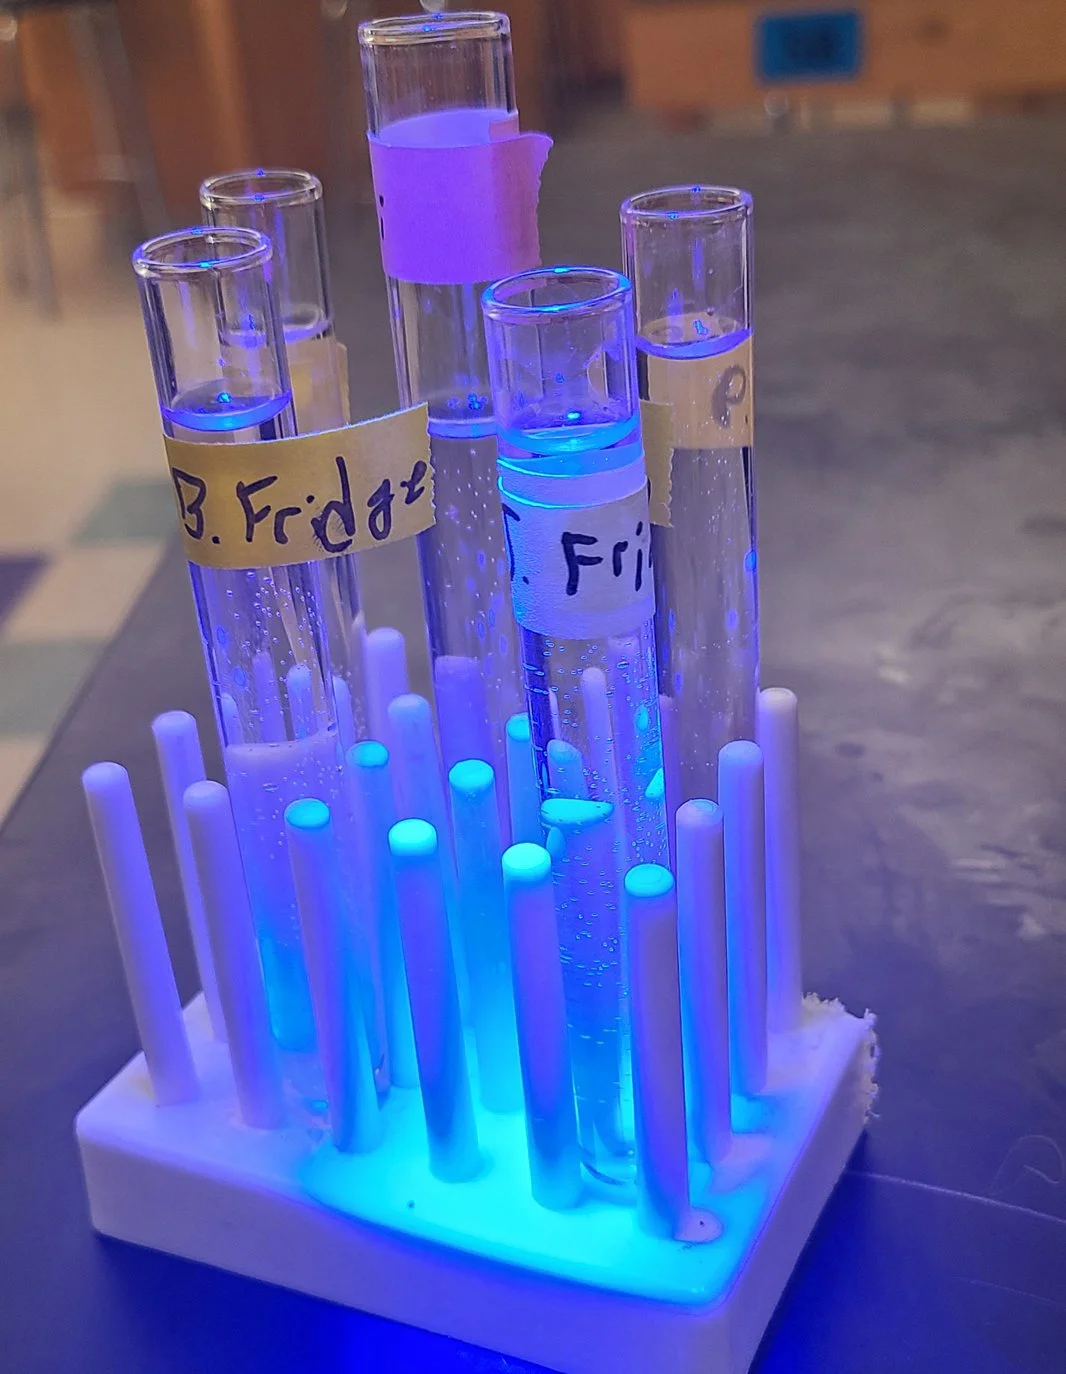
6. Afterwards students return to their lab tables and gaze at the water samples using the special blue crime lights, orange-colored protective goggles, and 10 X magnifying glasses that have been provided. (See photos above.)
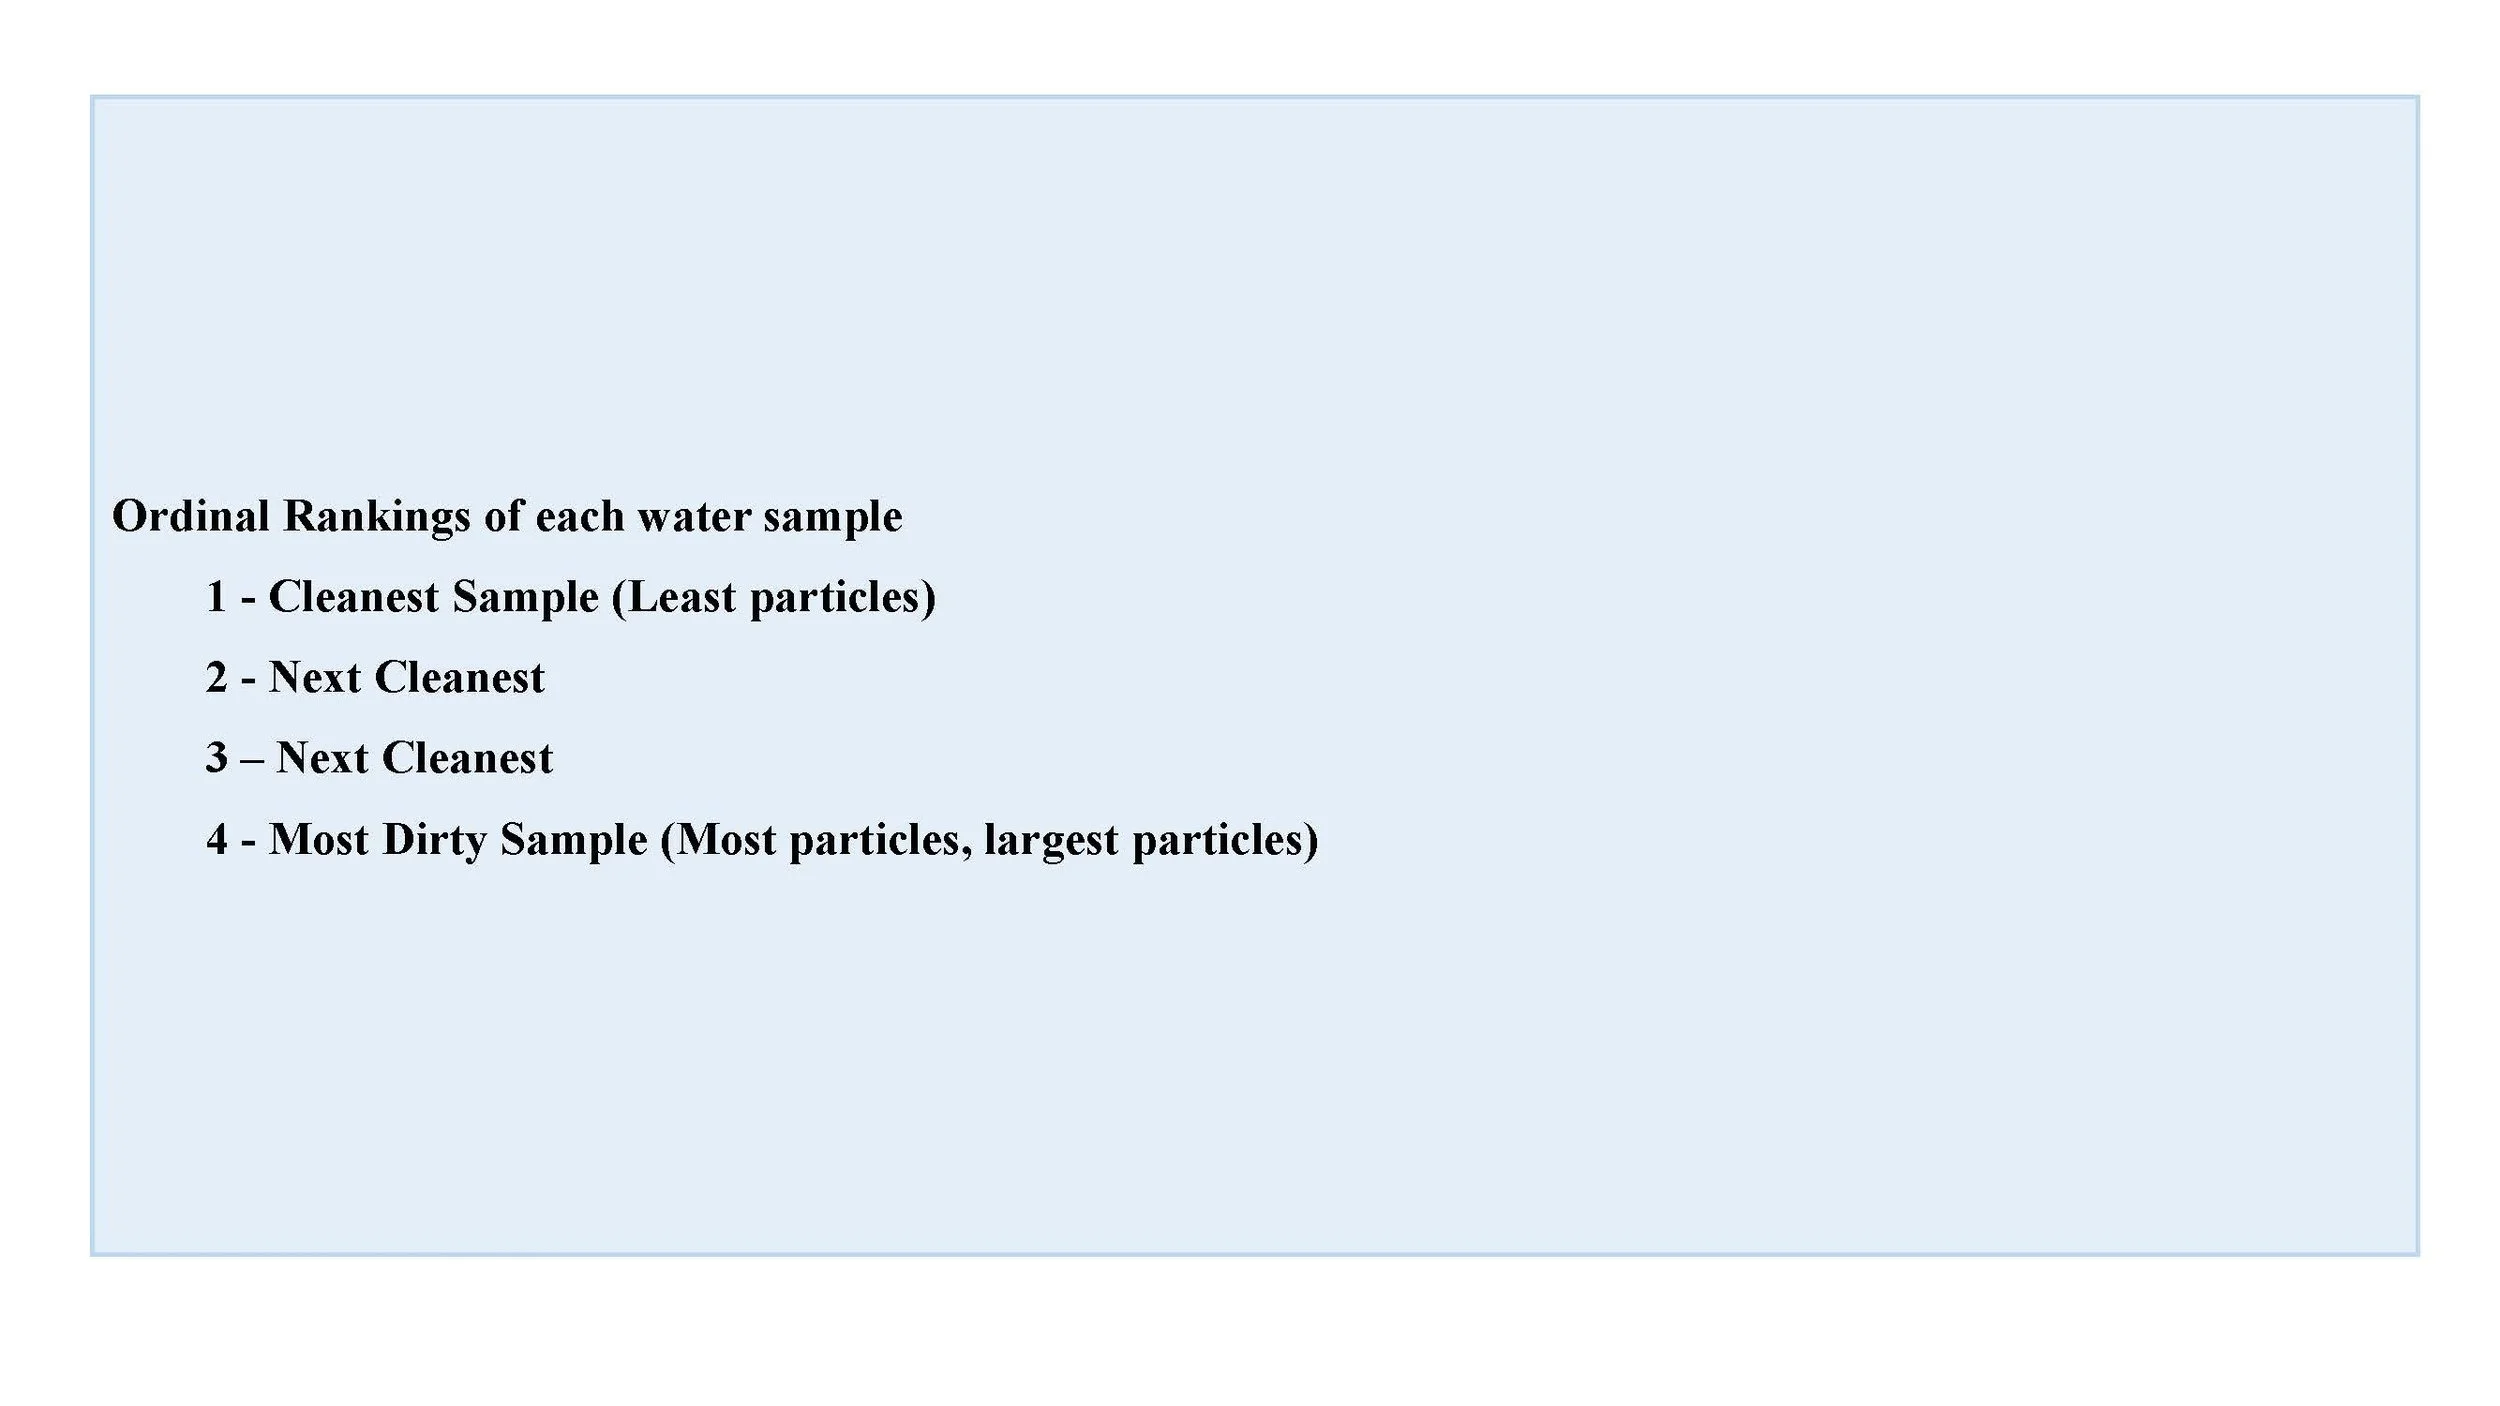
7. Students subjectively rank the samples from worst to best based on the density and size of the particles observed in the test tubes. The water samples are graded visually by inspecting the test tubes from various angles and looking for the Nile Red fluorescence identifying the microparticles and give a ranking number of 1 to 4, with 1 being the cleanest and 4 being the worst based on the most particles and the largest particles seen. Each team then consolidates their individual reactions into the team’s combined ordinal ranking and entered the consensus subjective rankings on the whiteboard or on-line connection so that other teams can compare their results. The instructor combines the individual rankings into a class ranking using the ordinal scale.
8. Although results vary across the teams and classes, based on these independent exercises from different classes, a somewhat unexpected conclusion is that tap water from local wells are sometimes graded relatively the worst in terms of contamination of microplastic particles. In addition, some of the commercial bottled waters (and much more expensive) are also graded lower by a majority of the teams. One can expect a number of “ah ha’s!,” “oh my gosh!” and “Wows!”
Details of Ranking Tables
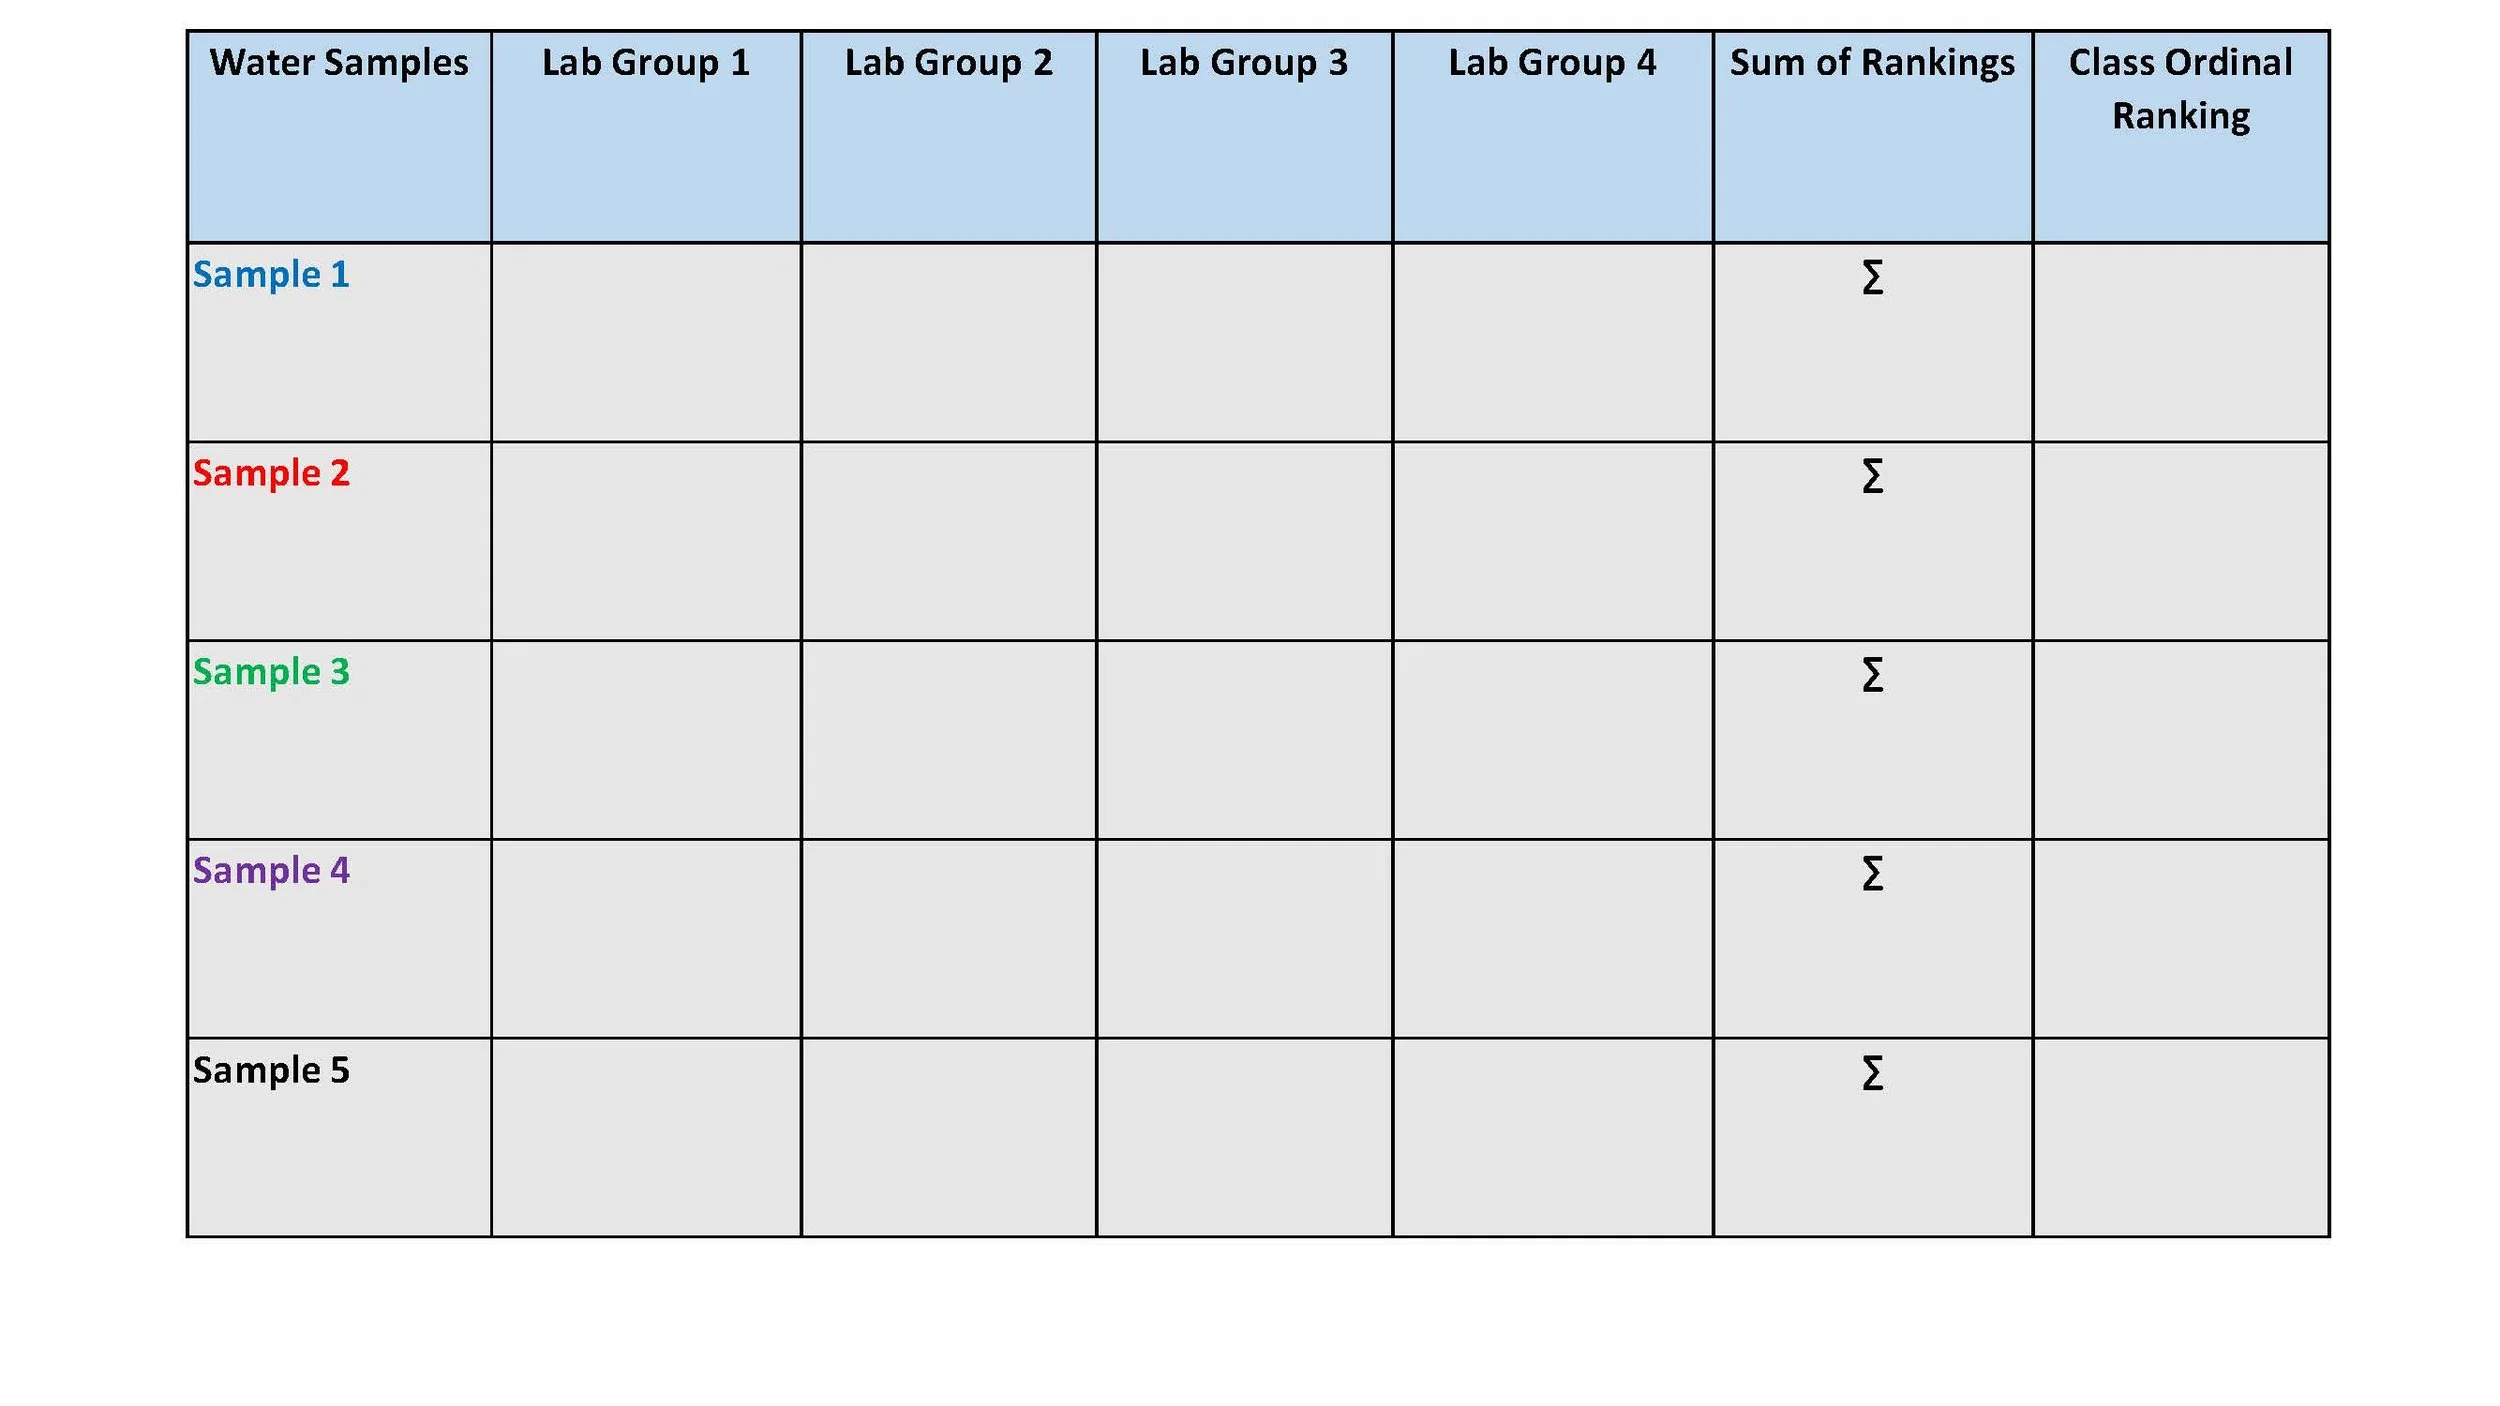
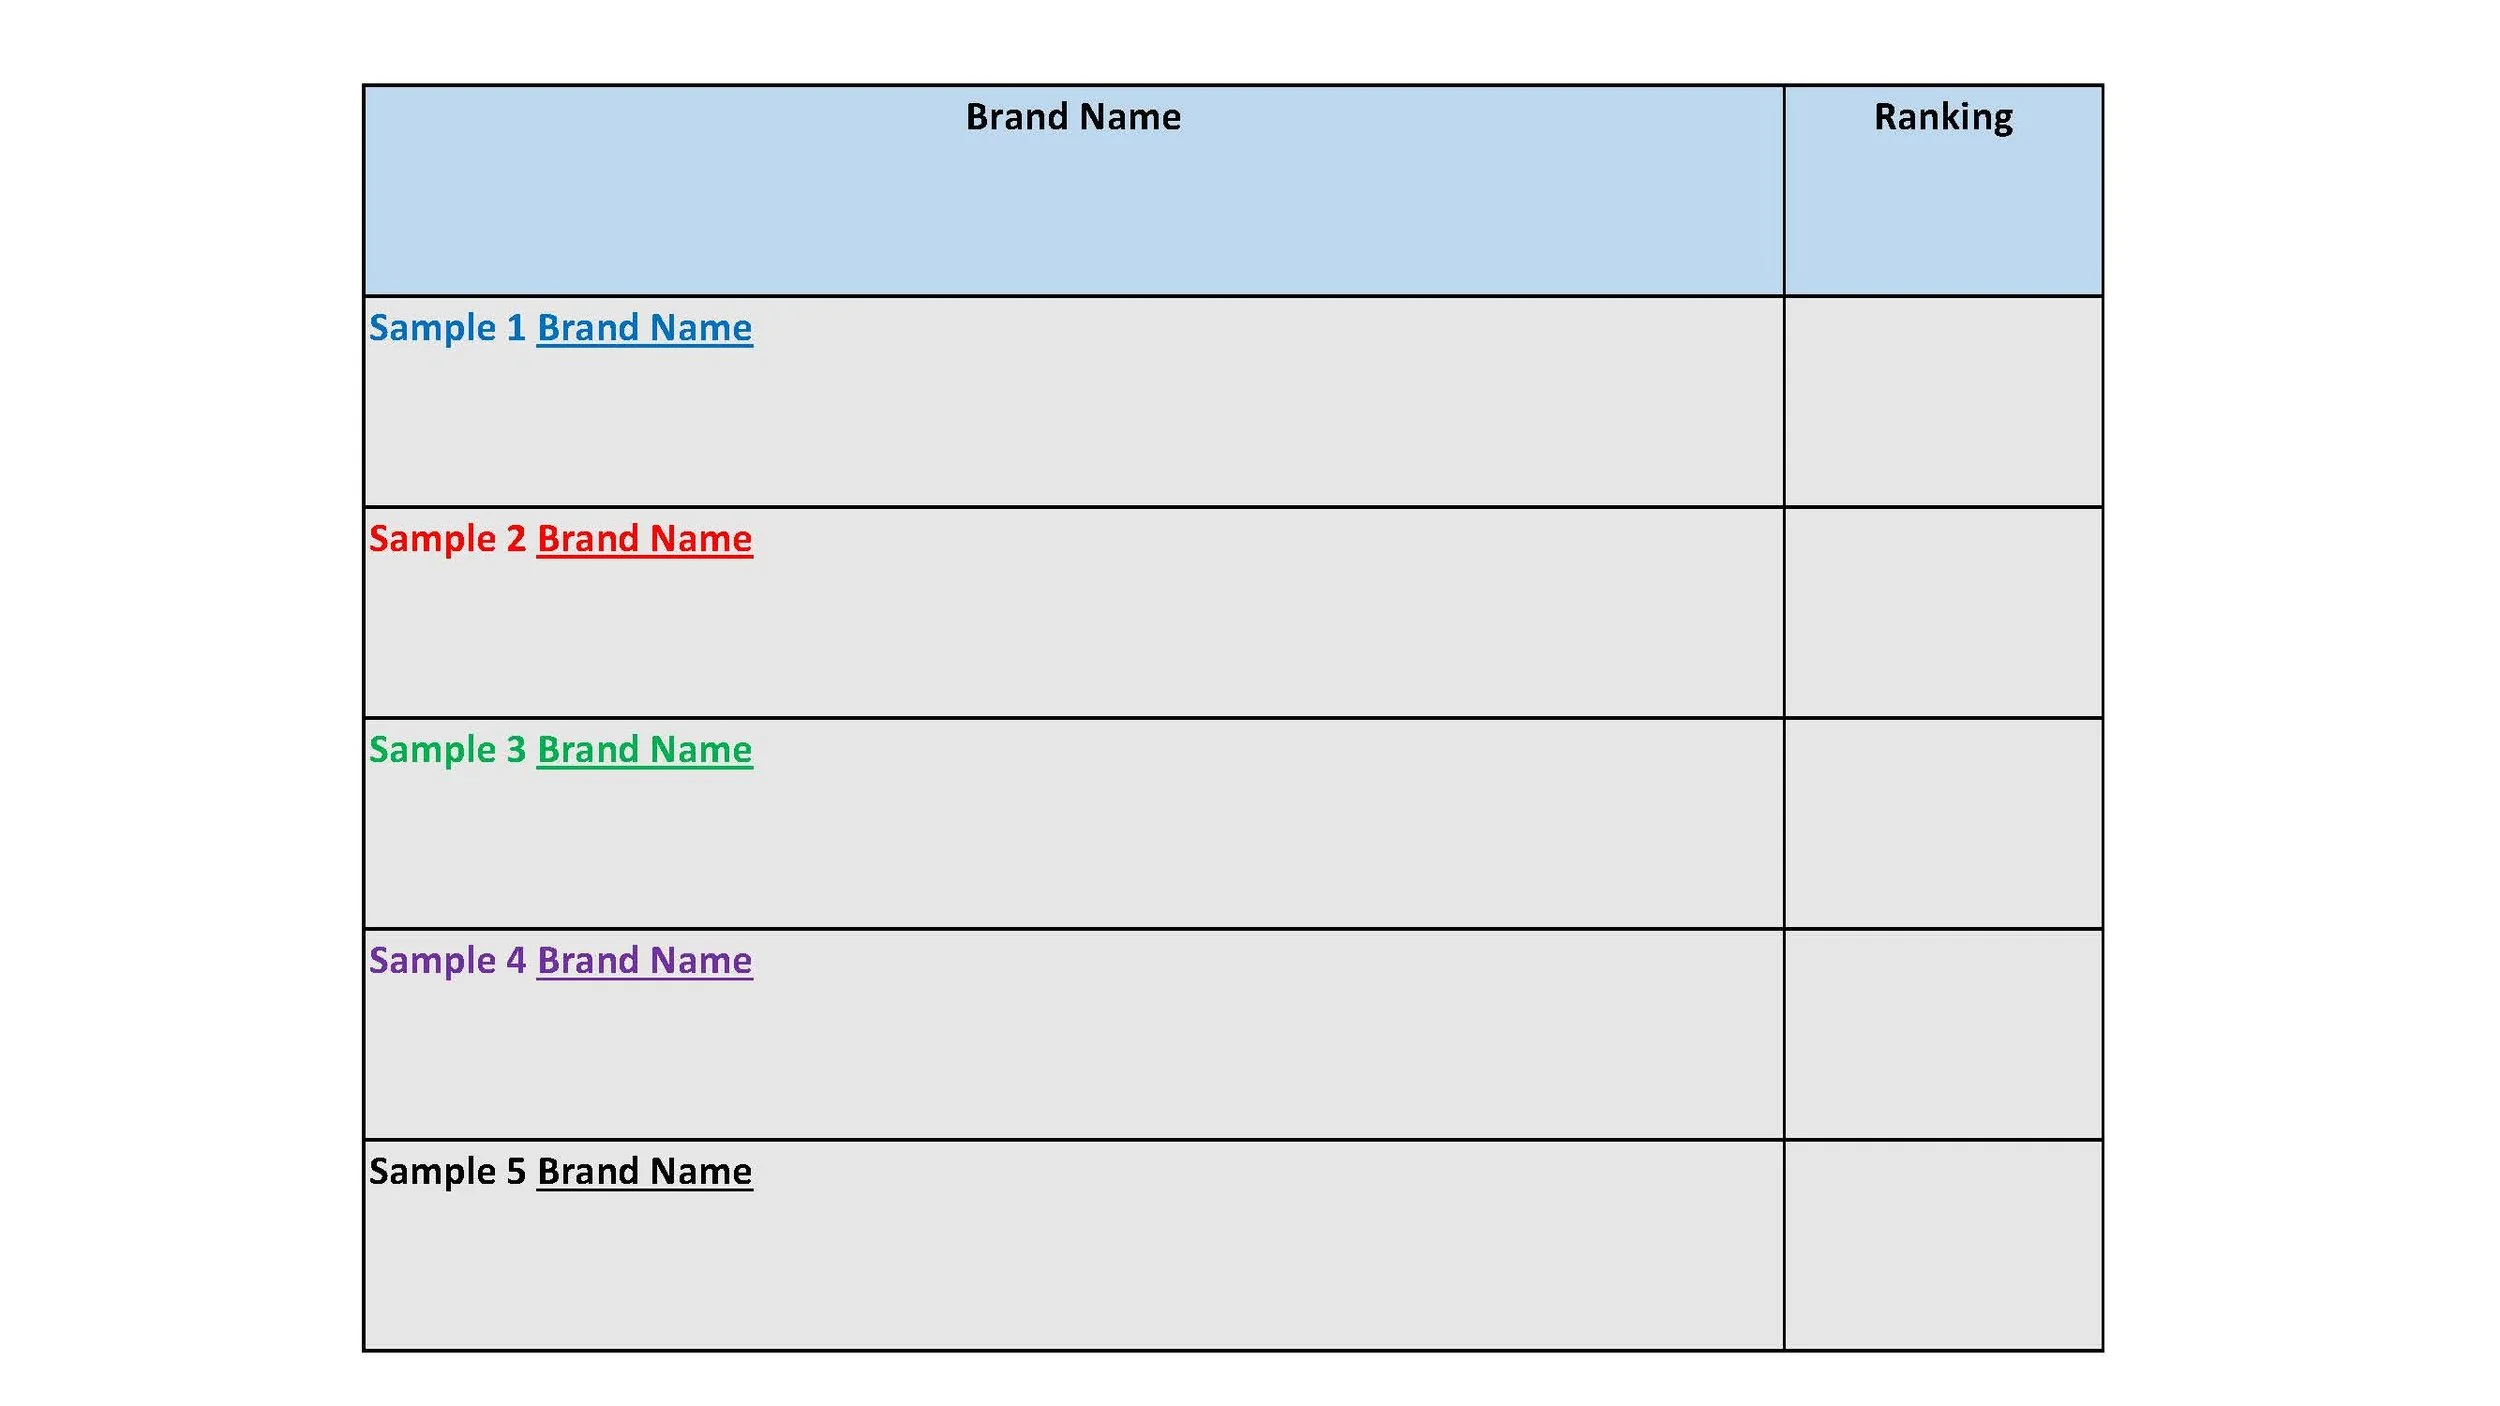
Each sample is given a score of 1 to 4 based on each team’s agreed upon ranking. Each lab team is given a small color-coded table to fill out that matches the color on the sample bottles. This means that all team members must agree on how “clean” or “dirty” each sample it.
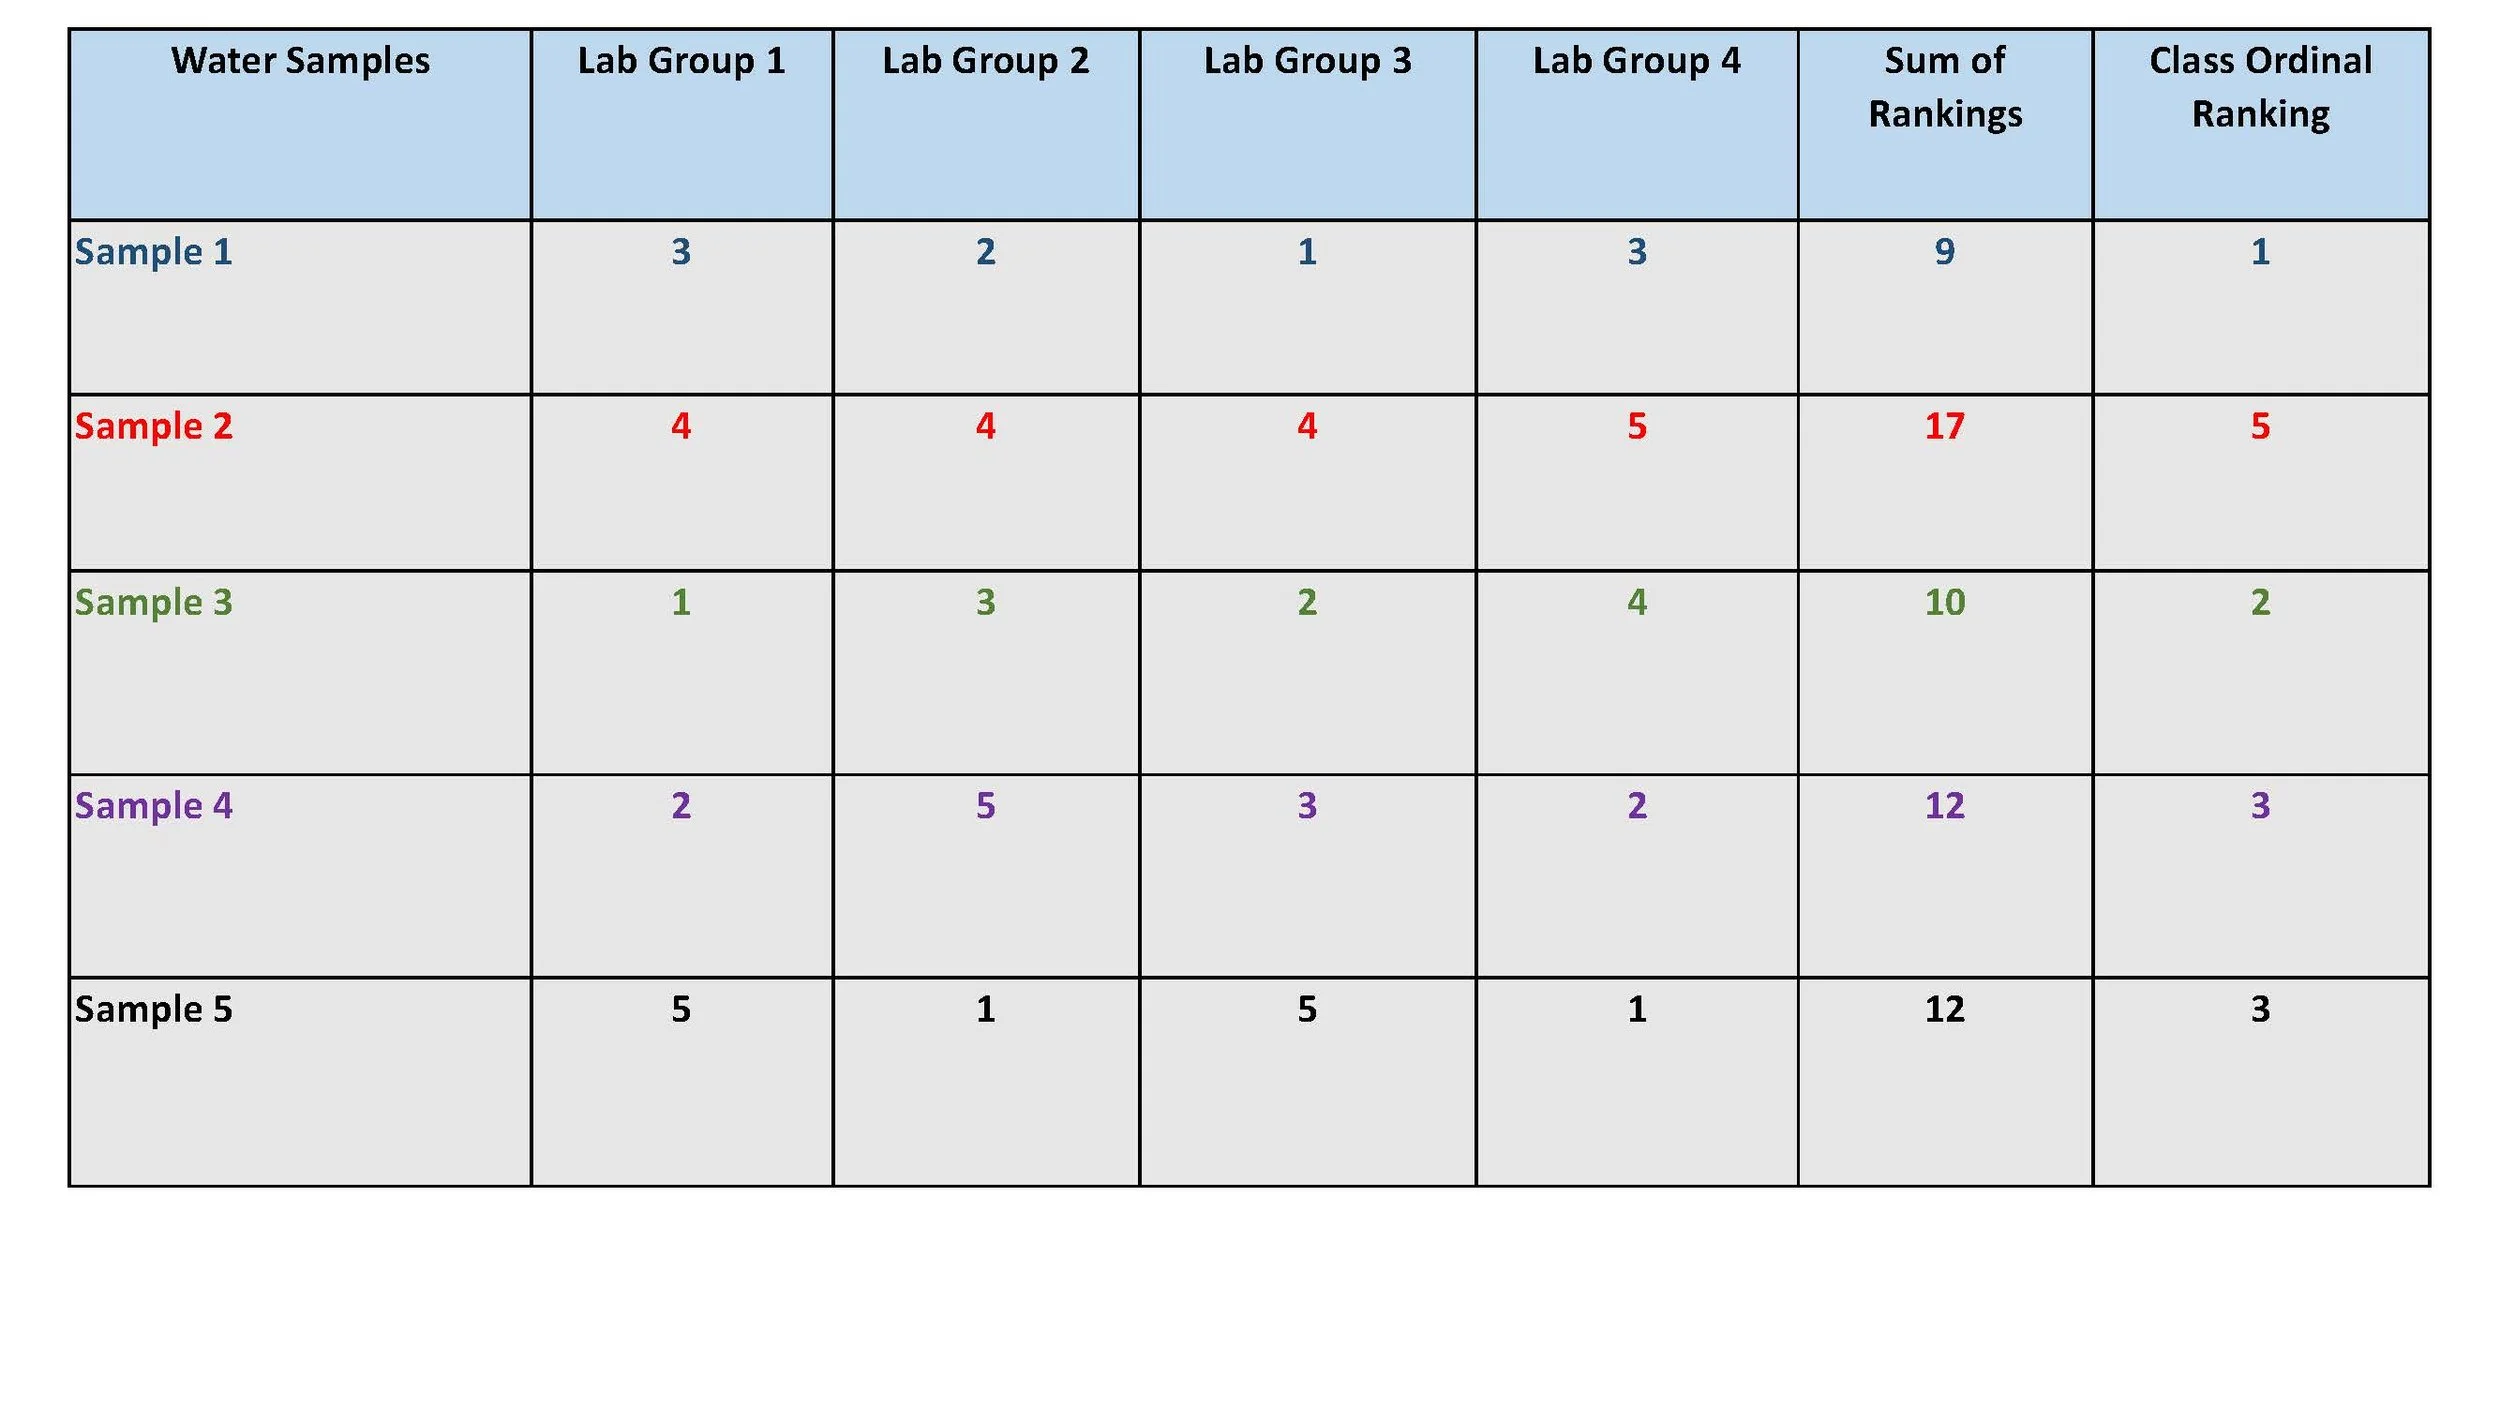
Some brands may have the same ranking. The instructor combines these to create the class ranking. The individual team scores are added together for each water sample and entered into the column “Sum of Rankings.” Then, these aggregate scores are ordinally ranked from best (lowest ranking, or 1) to most polluted with microparticles (highest ranking, or 5) and entered into the last column in the table. This is a simplistic and easily understood procedure that students quickly grasp and intuitively understand.
Here is an example from an actual class experiment and a summary of some of the conclusions reached:
Summary analysis of study results:
Sample 1 was graded the best with the lowest team scores of 1’s, 2’s, and 3’s and with the overall lowest combined score of 9.
This is followed closely by Sample 3 with most teams grading it 1’s. 2’s, and 3’s and an overall score of 10.
Sample 2 was graded the worst (4’s and 5’s by all groups) and with the highest combined score of 17.
Sample 2 has frequently scored most polluted by many other school laboratory experiments conducted.
Additional Details on Nile Red Stain
Pre-mixed Nile Red dye is obtained from Crime Scene Supply Company, Phoenix, Arizona, 706-896-9742. A small pint-sized bottle costs $40 plus shipping and takes 4 – 7 days to mix and travels only using ground transportation by USPS. The concentration of Nile Red Stain is 10 micrograms (mG) of Nile Red Dye per milliliter (mL) of acetone.
Water samples (7 - 8 mL) are put in 10 mL glass test tubes using sterile glass pipettes. Drops of Nile Red fluorescent stain in acetone (and kept chilled with ice) are added to each test tube. Test tubes are hand shaken to mix the Nile Red with the water samples. It was found by experimentation that twenty four (24) drops (about 1.2 mL) results in the most visible results. Initial readings were made after about 30 minutes in order for the chemical reaction between Red Nile and the plastic particles to be effective, and again repeated, if possible, after about 45 minutes to confirm results.
Experiment based on: Mason, Sherri A., et. al., Synthetic Polymer Contamination in Bottled Water, Department of Geology & Environmental Science, Fredonia State University of New York
Discussions with students – What do the Results Mean?
To kick off discussion and to get the class engaged in the meaning and significance of the lab results, MAG provides a list of questions and background readings. These are usually sent to the students a day or two before the class so they can think about the issues surrounding the results and formulate their responses.
Background readings can be found by pressing the following link:
Background Reading and Questions on Micro-plastics Found in Bottled Drinking Water
Class discussion questions:
How does plastic get into the drinking water containers in the first place?
Other than drinking water how else might you be exposed to microparticles of plastics?
Why do we use the “Nile Red” dye to identify plastic particles?
Should local, state, federal, and/or international organizations place an outright ban on production of single-use plastics such as water bottles, straws, or plastic bags?
Should governments implement policies and mechanisms to require recycling of plastics?
Should we have specific bans or economic disincentives on the use of certain types of plastics such as Concord, Cambridge, and Newton, MA?
What should you and your family do personally to reduce exposure to micro-particles of plastics?
What is the difference between “correlation” and “causation” in the studies of medical impacts of microplastics on humans?
What effect might these microparticles have on your body?
Backup Materials:
Illustration of microparticles and nanoparticles. Shows that microplastics are about 5 millimeters in size, or about the diameter of a human hair. Nanometers are much smaller - one thousands smaller — represented by the little dot in the middle of the circle representing the diameter of a human hair. The picture could be projected on the classroom screen or drawn on a whiteboard and explained to the students.

Individual lab group worksheet to record collective rankings.
Summary table for combining individual lab team results into overall classroom ordinal ranking.