
Experiments
#1 DETERMINING CARBON STORAGE IN LOCAL TREES
Minerva Action Group, Gil Rodgers, William Moomaw, and Robert Leverett, Revised, January 25, 2024.

INTRODUCTION
Have you hugged a tree today? You should! Trees are one of Mother Nature’s best creations.
Trees are the super absorbers of carbon dioxide (CO2), a gas that traps radiant heat from the earth causing global warming that in turn is overheating the planet. But not only that, trees provide:
Habitat for birds and other animals and insects
Shade and cooling as they evaporate water from their leaves for those hot summer days
Evaporation of water through the leaves helps to avoid floods and roots prevent soil erosion.
Today you are going to be a citizen scientist and calculate the amount of CO2 that a tree absorbs each year and how much it has accumulated during its life to the present time. The answer may surprise you. And finally, you will learn how to determine how many trees it takes to off-set (absorb) the same amount of CO2 that is produced by driving a car. So, let’s get to it...time to be a citizen scientist.
You may have a favorite tree nearby in your own backyard, outside your school or in your neighborhood. How much carbon do you think this tree stores? You can estimate (an accurate determination is not simple) the amount of carbon stored in your favorite tree using simple materials and calculations.
First, watch this video below that describes carbon storage in a white pine (pinus strobus) tree in a typical Massachusetts forest.
As you watch, write down three facts about carbon storage in trees you think are important to share with the class before you begin this activity.

The video takes only about 10 minutes to watch and is based on a forest in Massachusetts explaining carbon accumulation in white pines. (Note, this video features a middle- and a high school student with their teacher, who is a climate scientist.) Instructions also demonstrate the calculation from measurements of carbon in a Northern Red Oak. Here are a few comments on the video:
Include a grove of red oaks and white pines as examples.
Include both smaller trees 6-8 inches in diameter and much bigger, older trees 18 – 24 inches in diameter.
Explain that carbon is stored not only in the trunks and limbs but also underground in roots and some in the leaves.
Explain that bigger, older trees store more carbon and with ageing they are able to accumulate more carbon.
Explain that when leaves or needles fall to the ground, they are converted to soil carbon and that in older forests this can amount to half or more of the carbon stored on each acre of land. When trees are harvested and no more leaves are becoming soil carbon, the stored carbon will be converted by soil bacteria and fungi into water and carbon dioxide that is released back into the air.
Explain that bigger trees store more carbon because of their size alone, but they also accumulate carbon more rapidly than when younger.
Explain that only about half of a tree that is cut can be turned into a wood product, and the other half of the carbon is released back into the atmosphere relatively rapidly when the branches and processing wastes (sawdust and scraps) decay or are burned for energy.
Explain that a newly planted replacement tree must grow at least until it reaches the size (and approximate age) of the removed tree to accumulate as much carbon out of the atmosphere as was removed when the previous tree was cut.
Explain that Northern Red Oaks and White Pines commonly live well past 100 years. They can reach 200, and sometime over 300 years of age.
Explain the relationship between carbon storage and climate benefits.
DISCUSSION
As a class, share and discuss the three facts you wrote down about carbon storage in trees. Then, discuss the following question:
Why should we care about how much carbon a tree stores?
INVESTIGATION: How Much Carbon is Stored in a Local Tree?
In this activity, you will estimate the amount of carbon stored in a local tree. You will develop a set of skills that you can use on urban trees to trees in the middle of forests. These skills include:
Identifying species names and common names of trees.
Determine a tree’s height (H) by using similar triangles (see instructions below) and determine the diameter by measuring its circumference (C) with a tape measure. The diameter can be determined, D=C/π.
Use a slightly modified equation to calculate the volume of a tall thin cone for the trunk. From the wood density for the species, calculate the mass of the wood. The slight deviation from the familiar formula for a cylinder, V = Hπ(𝐷/2)^2. The circumference is determined at 4.5 feet above the ground. The carbon stored in a tree is approximately 50% of the mass of wood.
Calculate the approximate mass of CO2 taken in by your tree to determine the carbon stored.
Materials Needed for Experiment
This experiment will require a few simple tools:
A tape measure at least 10 feet long
A longer tape measure 50-100 feet long (a string that stretches from the observer to the tree may be used to determine the distance, and that distance can then be measured by using the short tape measure)
Computer to show video and summarize results in a spread sheet table.
MEASUREMENTS AND CALCULATIONS FOR TWO WHITE PINES SHOWN IN THE VIDEO

You will make similar measurements on two trees, See Appendix for a spread sheet where you can record your own measurements for a white pine or for a northern red oak. (The formulas will be approximately current for any conifer. However, for other species the factors will be different).
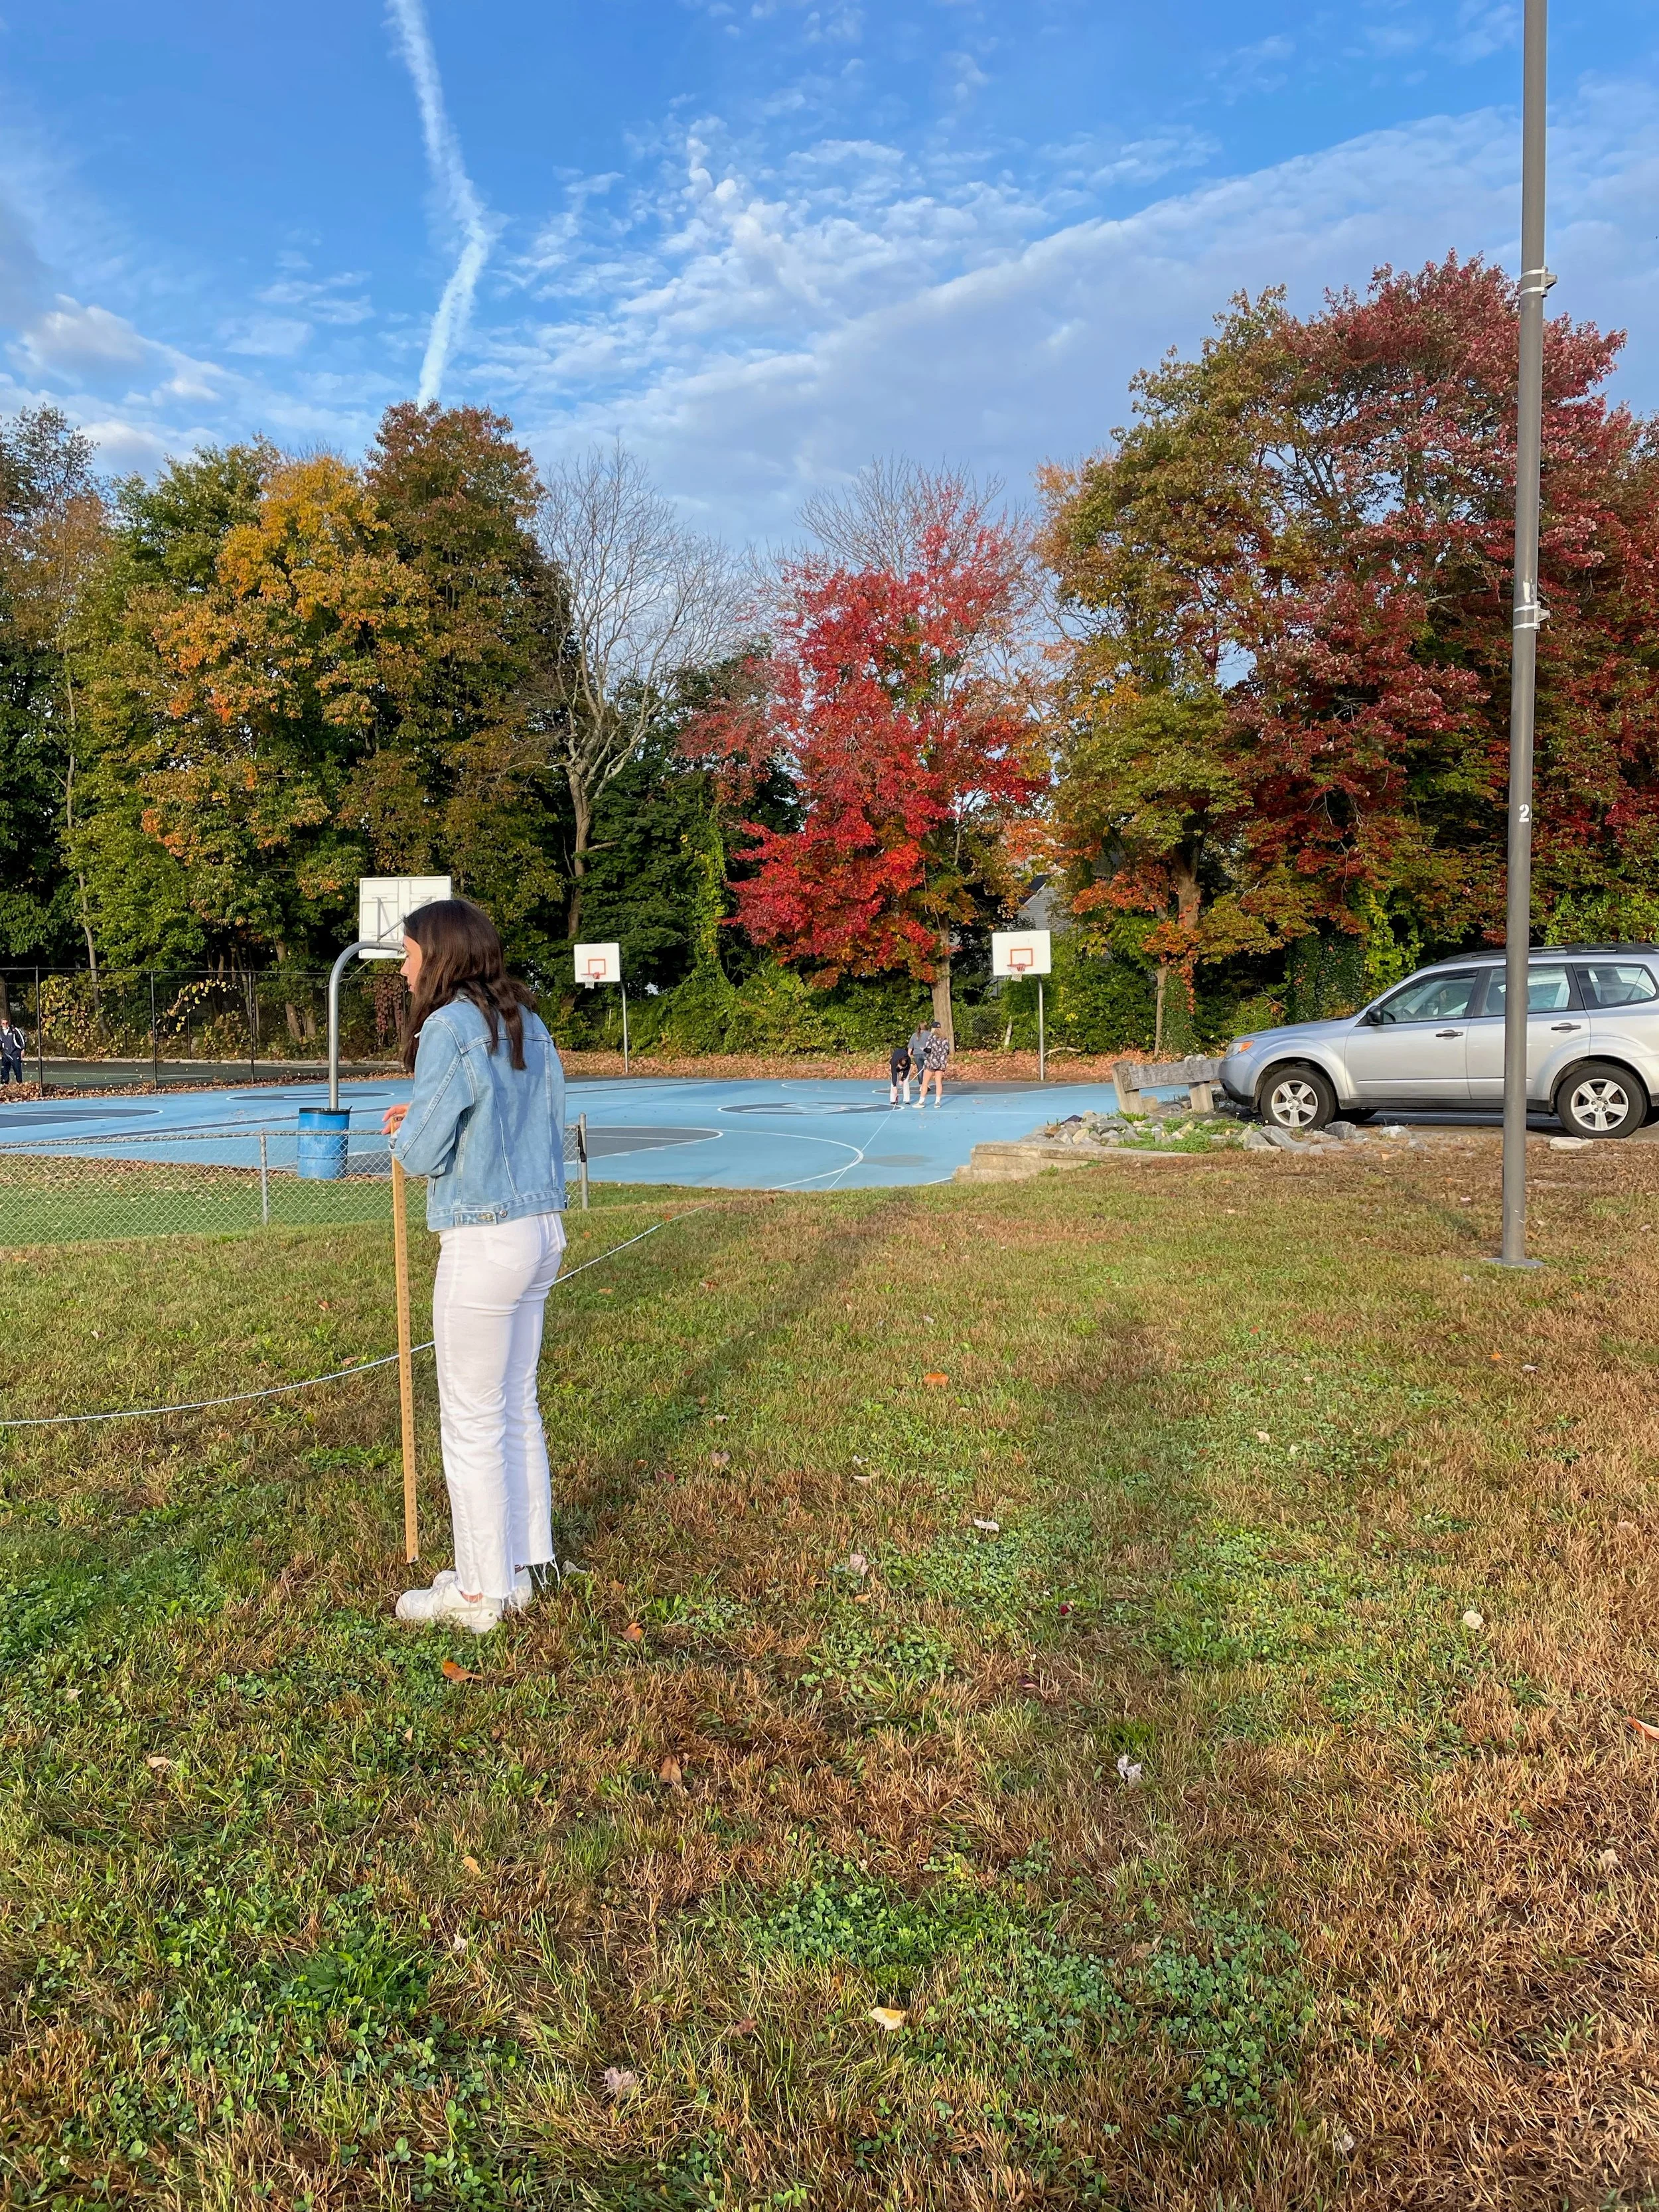
Measure height by using similar triangles. See Figure 1 that is taken from the American Forests Tree Measuring Guide. (www.americanforests.org)
The measured distance to the tree is A. It is relatively easy to measure the sighted height of the tree along the yard stick held in the hand, b, and the distance from the eye to the yardstick, a.
Steps:
Hold a ruler or yardstick vertically at arm’s length. Move forward or backward from the tree until the part of the stick from the top of your hand to the top of the stick just covers the tree.
Measure the length of the stick above your hand to get the side b of the small triangle abc. A plumb bob attached to the top of the stick can help you ensure that it is held vertically.
From this position measure the distance from your eye to the top of your hand. This is distance a. You can get this distance by extending a string from your eye to your hand and measuring the string length.
Next, with a tape measure, measure the distance from your eye past the top of your hand and on to the base of the tree. This distance is A.
It is relatively easy to measure the sighted height of the tree along the yard stick held in the hand, b, and the distance from the eye to the yardstick, a.
Then by similar triangles, B/A = b/a, and the height of the tree H = B = A(b/a) . Insert the value H into worksheet table below.
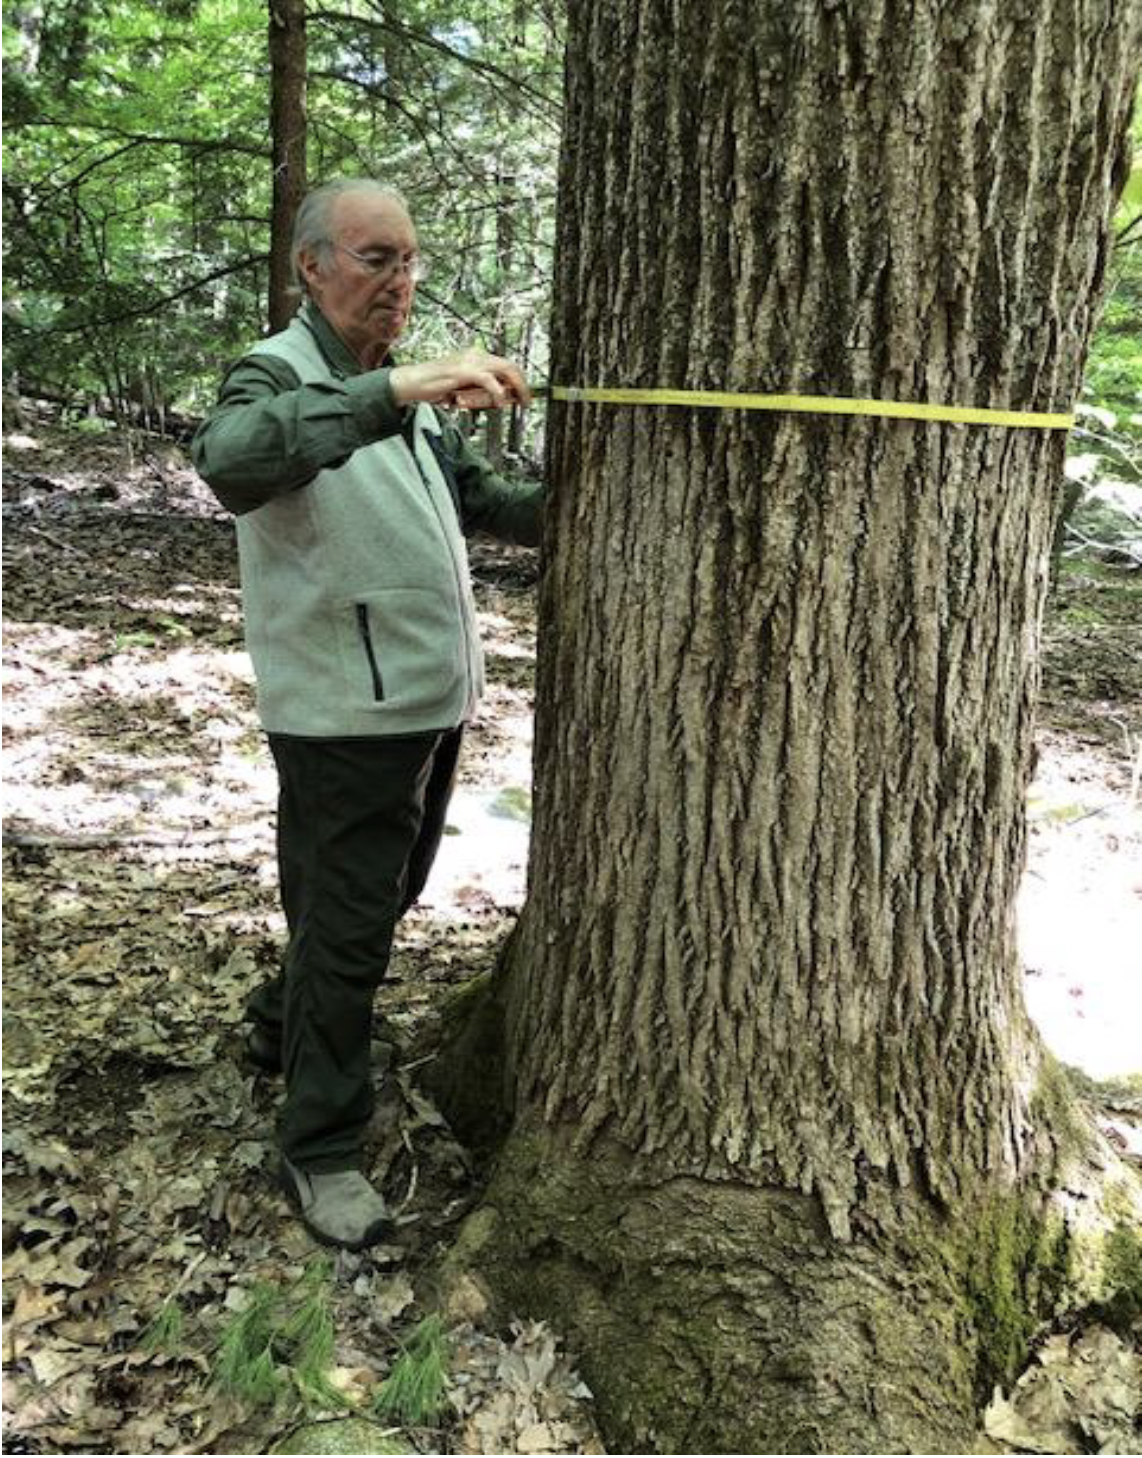
Then measure circumference, G, and record the height and the circumference in the appropriate place in your spread sheet. See example calculations below from the video.
In the tables below a calculation is made of the volume of the trunk (step 5). The formula is based on the familiar equation for the volume of a cylinder which is V = Hπ(𝐷/2)^2, where: V = total volume (ft3), H = total tree height (ft), and D = diameter at 4.5 feet. This is modified by a species-specific Form Factor “C” to reflect that the true volume of trunks doesn’t exactly shape a perfect cylinder. “C’s” for specific trees have been estimated empirically using data obtained from the US Forestry Service, Forestry Inventory and Analysis Program. (US Forest Service, Forest Inventory and Analysis National Program, Forest Carbon Science and Reporting, https://www.fia.fs.fed.us/forestcarbon/default.asp)
For example, in the table below on line 5 the ‘C” is 34% for a large white pine. However, the resulting equations offer good predictive tools. The greatest variation for pines was 4.3% and 5% for oaks. Most variances were under 2% for both species.
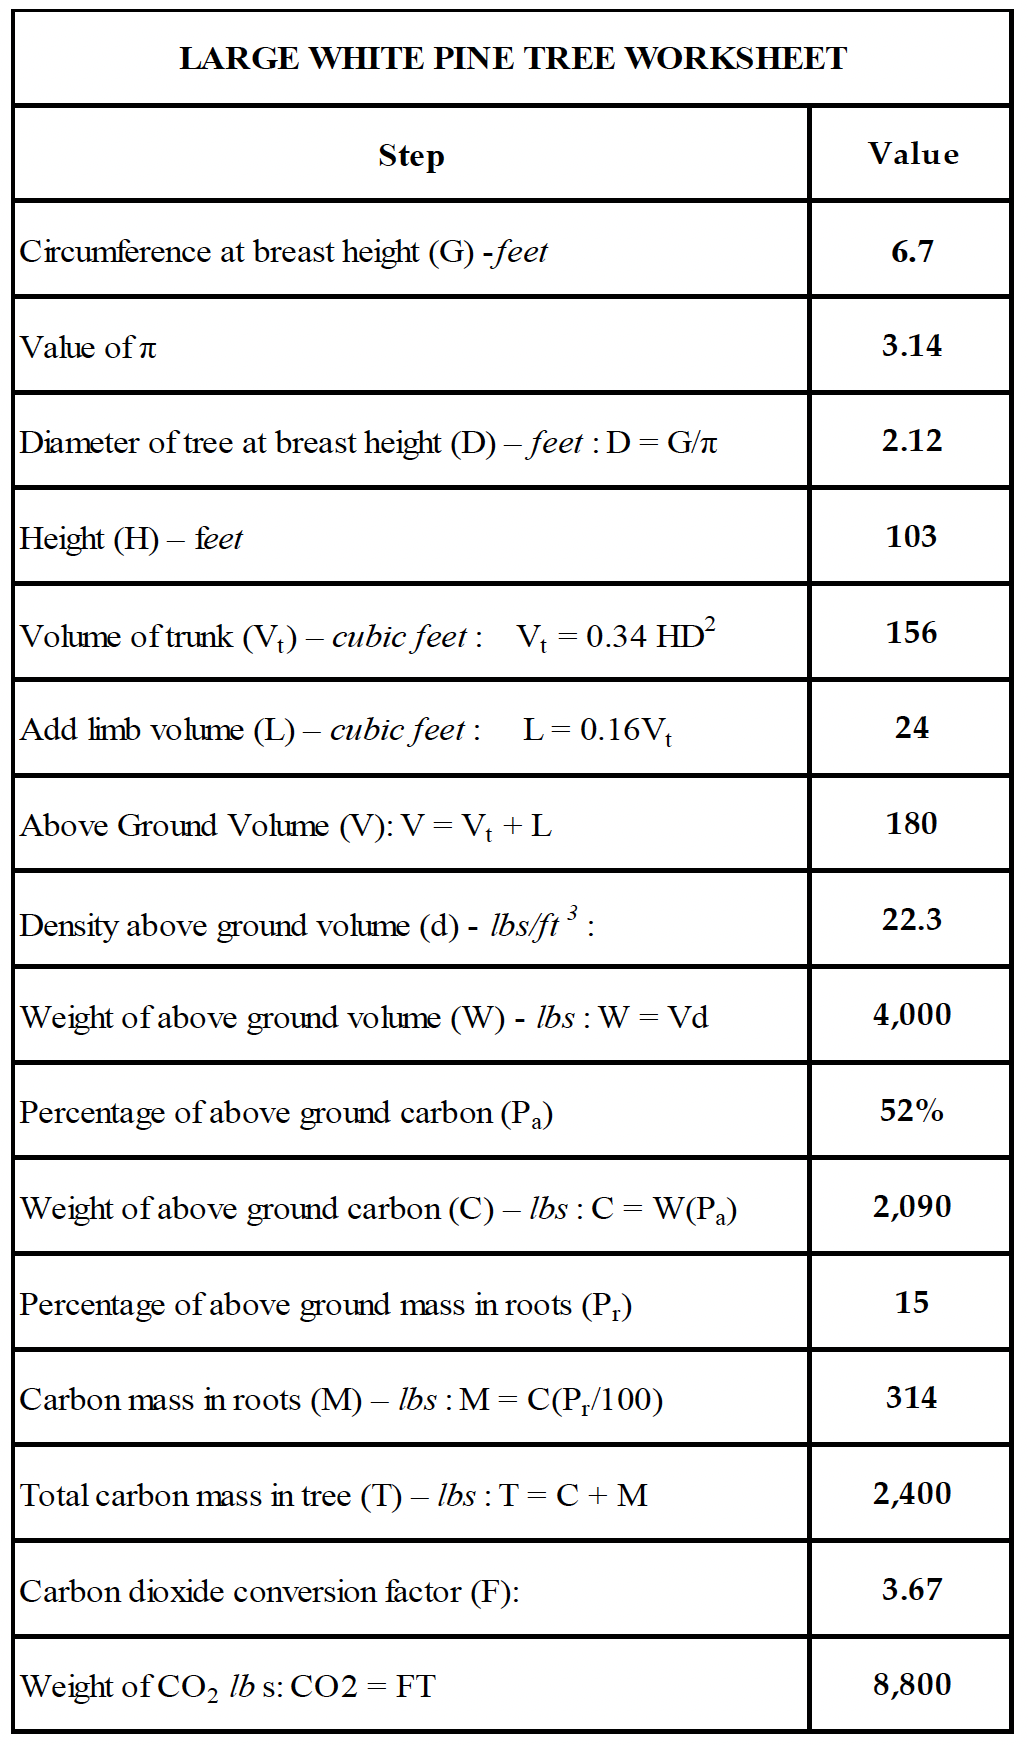
Example #1 Large White Pine Tree
Height of large white pine H = B = A(b/a) = 94.5 (2.00/1.83) = 103 feet
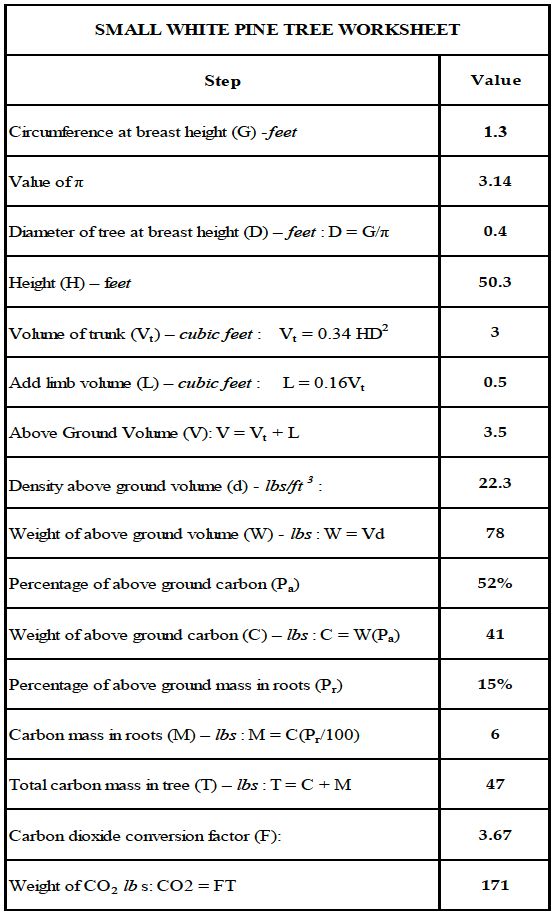
Example #2 Small White Pine Tree
Height of small white pine H = B = A(b/a) = 50.3 (1.83/1.83) = 50.3 feet
Blank worksheets for white pines and red oaks are included in the appendix for you to fill in. The worksheets for white pines are the same as those shown here, but the red oak one is different. While pine trees consist of a single, conical shaped trunk with branches, an oak has a thick, but relatively short trunk with many irregularly shaped branches. Estimating the volume and hence the carbon in those irregularly shaped trees requires utilization of mathematical formulas that are based upon direct measurements of many oak trees. It is therefore possible to determine the volume of different shapes by measuring just the circumference and height.
Discussion
As a class combine your results on a single sheet creating a table like this:
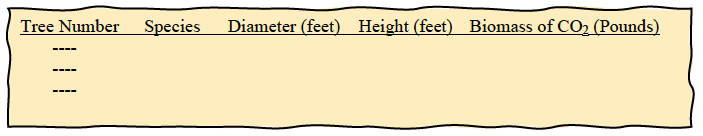
How many pounds of CO2 did your single local tree remove from the atmosphere and store in its biomass?
Compare different sizes and types of trees.
Which trees have removed most atmospheric CO2?
Why do you think they store more carbon?
What about trees that are much older such as 250 years?
What is the important lesson you learned from this experiment?
Comparison with Emission from Your Family Car
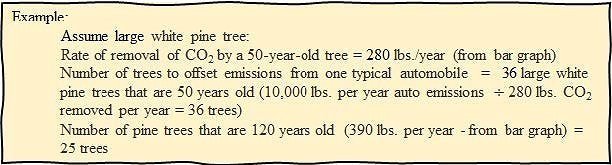
Let’s put this in understandable terms related to driving your car. Gasoline-powered cars emit CO2 and other pollutants when they are driven, and fossil fuel is burned. The US Environmental Protection Agency (EPA) estimates that the average automobile in the USA emits 10,000 lbs. of CO2 per year. (US Environmental Protection Agency, “Greenhouse Gas Emissions from a Typical Passenger Vehicle” https://www.epa.gov/greenvehicles/greenhouse-gas-emissions-typical-passenger-vehicle)
You need to compare these emissions produced per year to the amount of CO2 captured per year by each tree or a grove of trees. This is a particularly key point as the amount absorbed per year increases as the tree ages; up to a point, a larger, older tree sequesters more CO2 per year than a smaller younger tree each year.
This is confirmed by recent research that has been done for white pine trees and forests in Massachusetts and elsewhere in the Northeast. The bar graph below shows the amount of CO2 captured by a fast-growing white pine in Mohawk Trail State Forest, Massachusetts, during successive 10-year periods from 0 to 200 years. As we can see, the period of greatest carbon capture is from 50-120 years, and there is significant accumulation through 150 years. Growth past 150 years slows down but is still considerable. The projection from 150 to 200 years is based on extensive data from older white pines in the vicinity of the one being modeled.
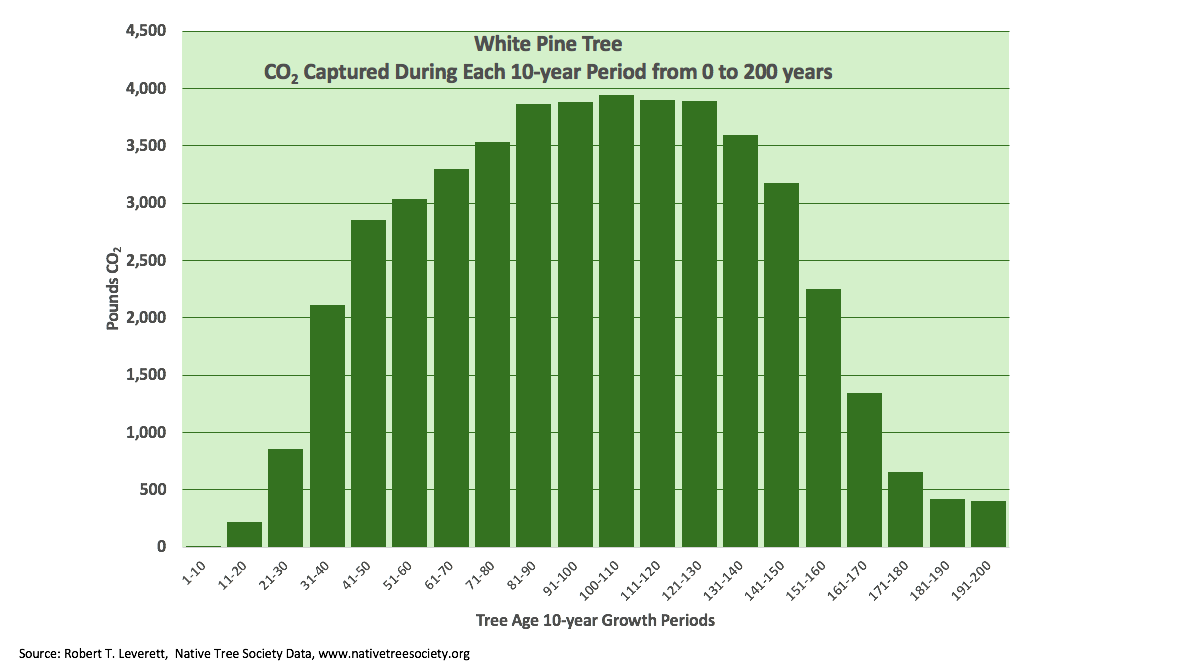
As the tree ages and gets broader and taller the rate of CO2 sequestration increases to 224 pounds per year for the next 50 years of their life (from 50 to 100 years old.) Still older large, white pine trees have been estimated to sequester CO2 at a rate as much as 360 pounds per year and as high as 660 pounds per year at even older ages (almost three times the rate of younger trees.)
As shown in the bar graph trees capture carbon at a significantly higher rate than younger ones. While planting numerous young trees is ultimately beneficial, such actions would require many years to match carbon absorption rate of older trees.
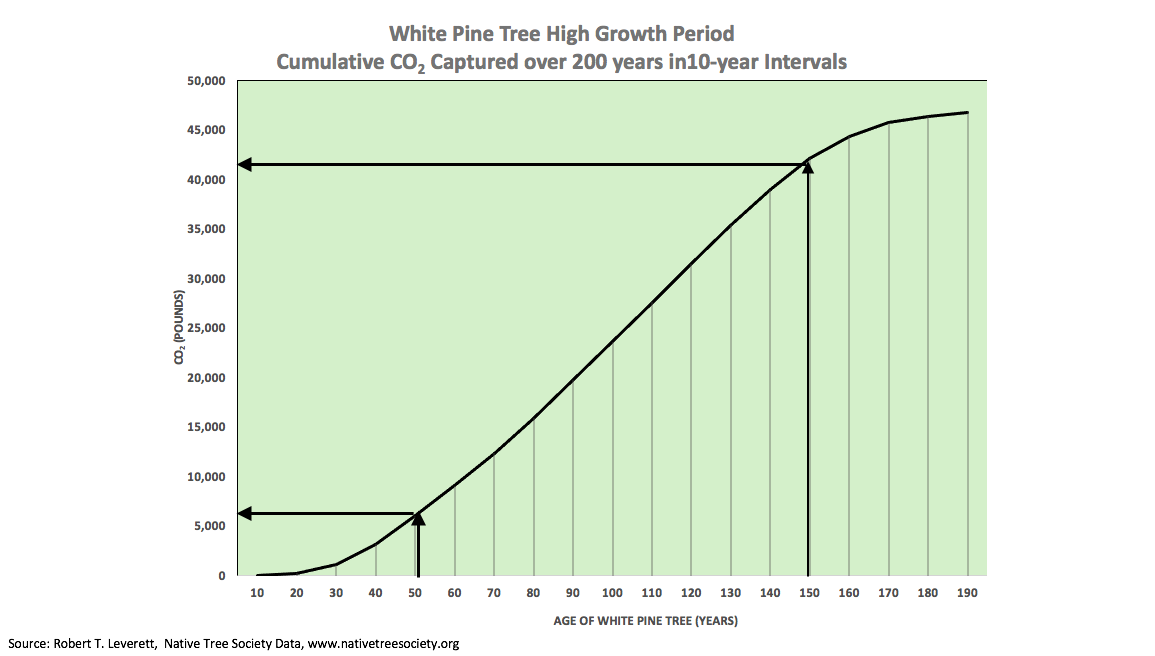
As we can see in the line graph below for the test pine, the cumulative CO2 continually increases over the years and by age 200 is projected to be almost 47,000 lbs.
As another example of CO2 capture, U.S. Dept of Energy Information Agency released a study in 1998 that shows a 50-year-old moderate- to fast-growing hardwood sequesters CO2 at a rate of between 250 - 450 lbs. per year. Up to a point, as trees in the Northeast get older the amount of carbon stored increases, but for the period from 50 to past 125 years, the annual amount of CO2 capture increases as well. The result is that a healthy 100-year-old northern red oak will have drawn from 14,000 to 28,000 lbs. of CO2 out of the atmosphere. An oak capturing 28,000 lbs. of CO2 is likely to be in the size range of 40 inches in diameter and 100 to 110 feet tall. (US Department of Energy, EIA, “Calculating Carbon Sequestration by Trees in Urban and Suburban Settings,” April 1998, https://www3.epa.gov/climatechange/Downloads/method-calculating-carbon-sequestration-trees-urban-and-suburban-settings.pdf)

Source: Robert T. Leverett
Older trees store carbon in significantly higher amounts than younger ones (an obvious result of tree growth), and up to a point (that varies with species but is usually well over 100 years), at significantly higher annual rates. While planting numerous young trees is ultimately beneficial, such actions would require many years to match carbon absorption rate of older, established trees. Tree statistics show that small trees contain much less carbon than old trees, a fact that may not have been thought about. For example, this chart illustrates that it would take 465 new, large, oak landscape trees 25 feet tall and 4 inches in diameter to be equivalent in carbon dioxide sequestration to one large, mature, oak canopy tree 100 feet tall and 54 inches in diameter.
Analysis of data across the US indicates a worrying trend in the loss of older and middle-aged trees, with American Northeast being particularly affected. While planting new trees is beneficial in the very long term, it does not immediately compensate for the loss of mature trees in terms of carbon sequestration.
As the tree gets older the rate of CO2 sequestration increases as can be seen from the graphs above, and the number of trees needed to offset the automobile emissions in a year decreases. Assuming your tree is 50 or 120 years old, by simple division you can estimate how many of your trees are needed to remove the CO2 emissions from just one average passenger vehicle driven in US in one year. Here are the sample calculations. Do the arithmetic for your sample trees.
Discussion
Should trees be harvested for lumber when they are relatively young (e.g., 50 years) or should more be allowed to continue growing to accumulate more carbon during their prime years of sequestration?
Compare these results with other types of vehicles such as EVs, small pick-up trucks, diesel engines, etc.
What government policies should be developed and enforced to maximize the value of carbon sequestration in trees and national forests to address climate change?
A Call to Action
Extend the calculation to determine the CO2 absorption by the trees in your yard or outside your building. Get friends or classmates involved to determine the amount of CO2 absorption by trees in your neighborhood, or around your school.
Trees, Mother Nature’s super climate solution.
Have you hugged a tree today?
Appendix
Worksheets for Calculating Carbon in White Pines, Northern Red Oaks, Red Maple, and Sugar Maple Trees9
